Blog
"Que sua luz inspire os outros a encontrarem o melhor de si." - Fortunato Guirrugo

HYPSOMETRIC REPRESENTATION OF THE PROVINCE OF MANICA
June 24, 2024 | Fortunato Guirrugo
What is hypsometry?
Hypsometry is the study and representation of the elevation of land above sea level. Through hypsometry, it is possible to create maps that show the variations in altitude of a given area, using colors and contours to indicate different elevations.
What is a hypsometric map?
A hypsometric map is a cartographic representation that uses colors to indicate different terrain elevations. These maps are particularly useful for visualizing the topography of a region, making it easier to understand its geographical features such as mountains, valleys, and plains.
What valuable insights can we gain from analyzing hypsometry?
By analyzing hypsometry, we can obtain valuable information about:
1. Topography: Identifying and characterizing the shape of the terrain, including mountains, hills, valleys, and plains.
2. Territorial Planning: Assisting in the planning of infrastructure such as highways, railways, and urban development projects.
3. Natural Resource Management: Planning the exploration of natural resources and the management of watersheds.
4. Natural Disaster Prevention: Identifying risk areas for floods, landslides, and other natural disasters.
5. Ecology and Conservation: Identifying natural habitats and areas that need environmental conservation.
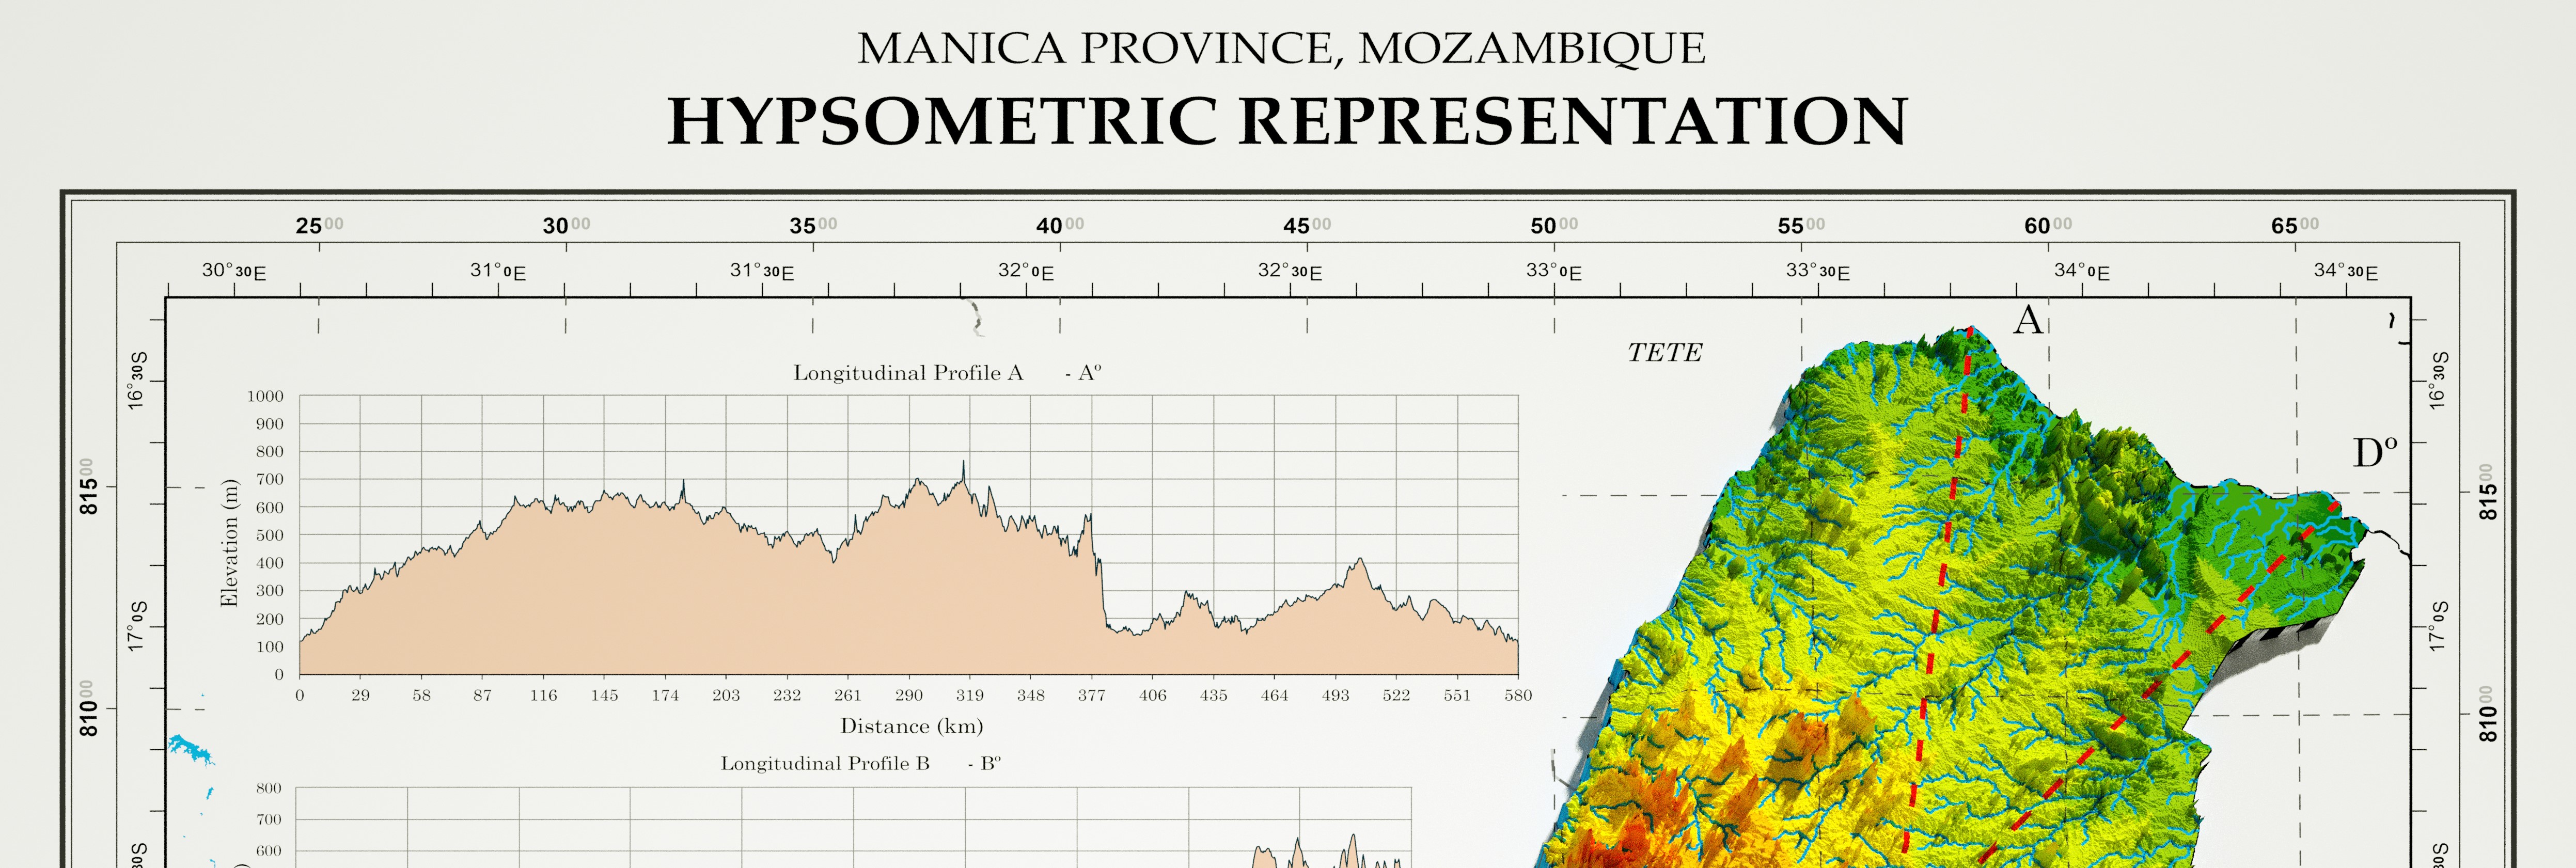
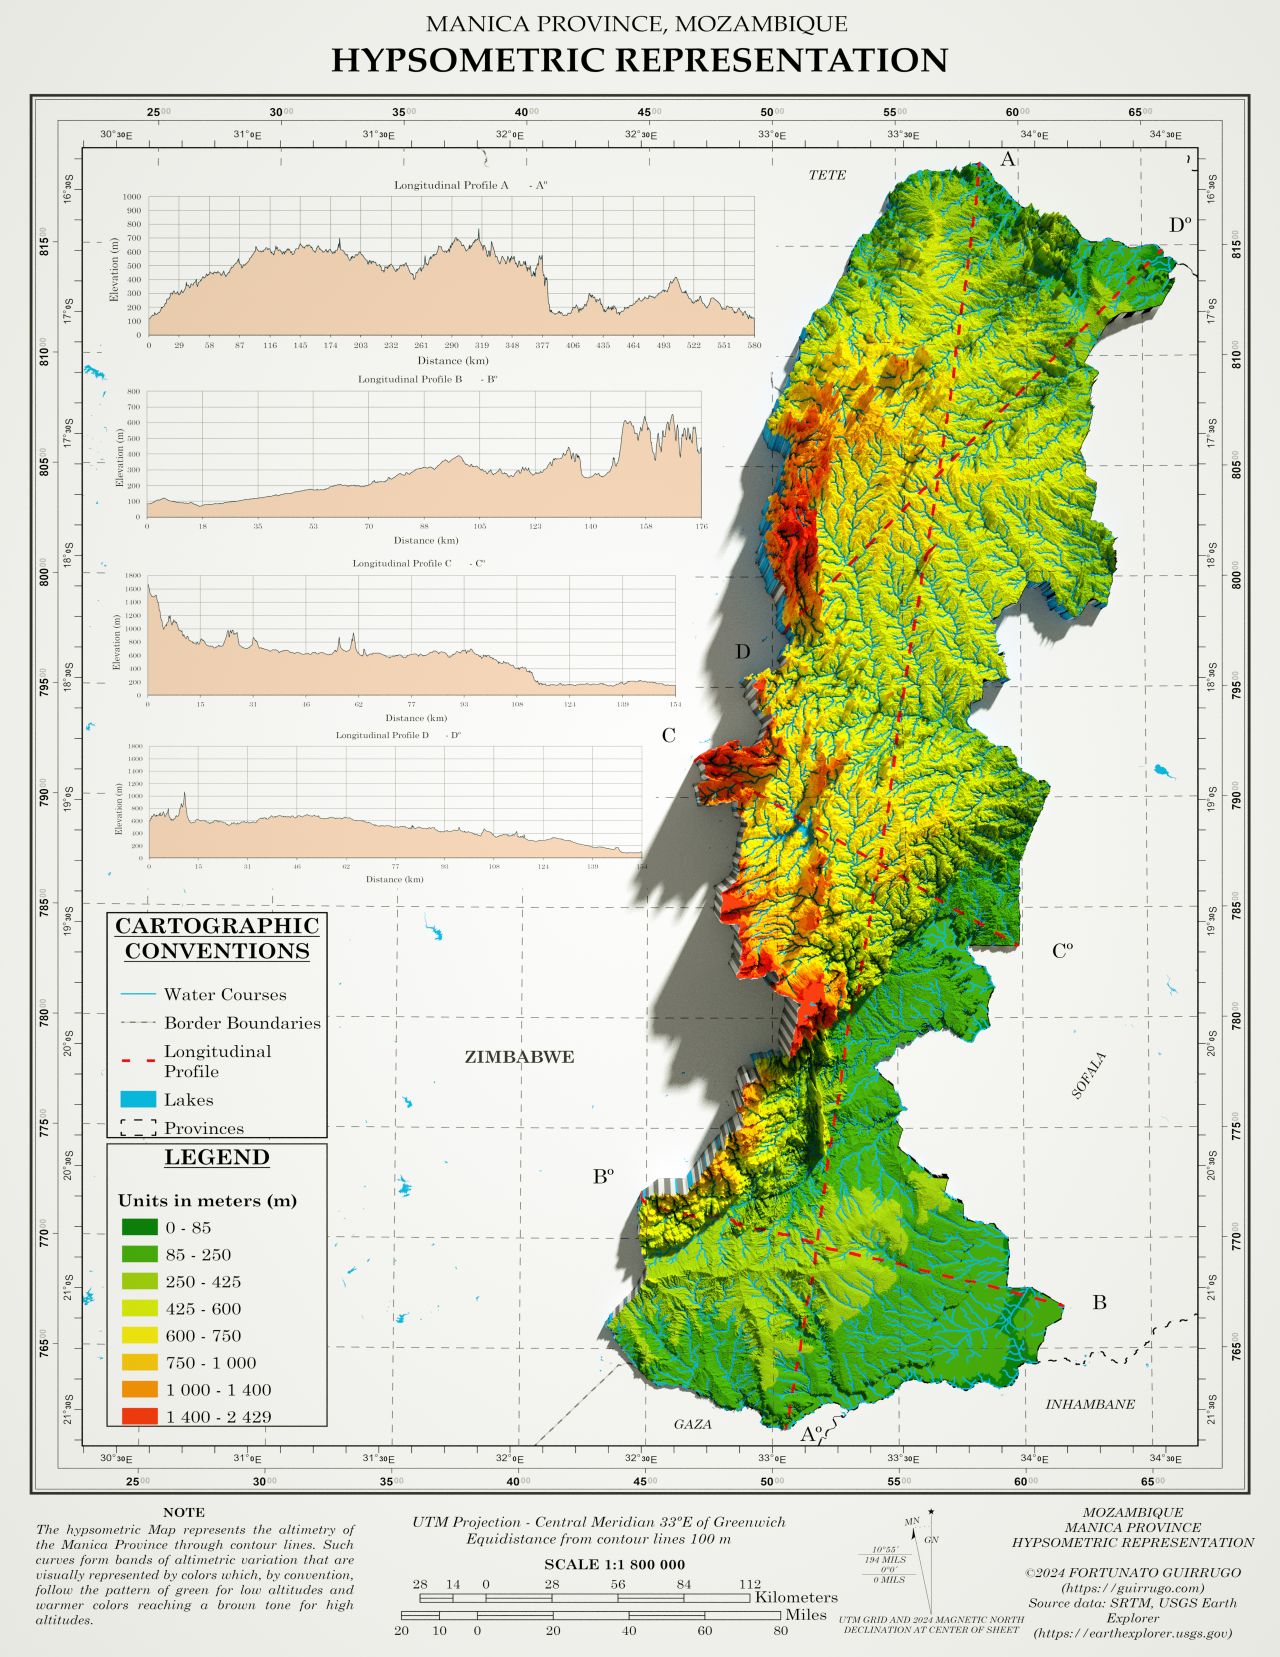
The hypsometric map provided represents Manica Province in Mozambique and shows the distribution of terrain elevations using a color scale and contours. The map is a three-dimensional representation of Manica Province, with a legend indicating different elevation ranges in meters. Elevations are color-coded, with green representing the lowest altitudes (0-85 meters) and dark brown representing the highest altitudes (1400-2429 meters). The map also includes watercourses, provincial boundaries, and longitudinal profiles A-A’, B-B’, C-C’, and D-D’.
The central region of Manica features the highest elevations, with mountainous areas exceeding 1400 meters. These areas are represented by colors ranging from orange to dark brown, indicating significant altitudes. In contrast, the southern areas and parts of the north and west of the province have lower altitudes, ranging from 0 to 250 meters. These areas are predominantly green, indicating lowlands and plains.
Longitudinal Profiles:
The longitudinal profiles provide a detailed view of the elevation variations along different sections of the province.
- Profile A-A’ shows significant elevation in the center.
- Profiles B-B’ and D-D’ show smoother variations, reflecting the region's diverse topography.
Hypsometry not only allows us to visualize terrain elevation but also provides critical insights that can guide sustainable development and effective management.
