Blog
"Que sua luz inspire os outros a encontrarem o melhor de si." - Fortunato Guirrugo

GEOSPATIAL REPRESENTATION WITH R STUDIO
June 8, 2024 | Fortunato Guirrugo
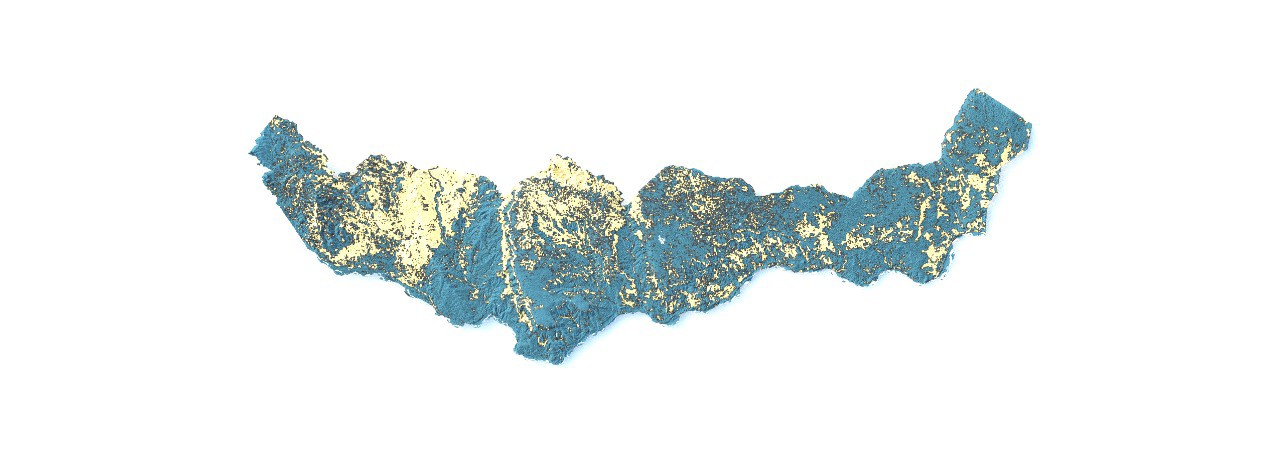
The use of geospatial analysis tools has become essential in various fields of knowledge, ranging from biology and ecology to engineering and urban planning. R Studio, an integrated development environment for the R programming language, is a powerful tool for creating detailed geospatial visualizations. In this article, we will discuss the creation and interpretation of a geospatial representation, such as the provided image, using popular packages in R Studio.
Methodology
- Setting Up the Environment
To begin, it's necessary to install and load the required packages in R Studio. Among the most common packages for manipulating and visualizing geospatial data are `sf`, `ggplot2`, `raster`, and `tmap`.
# Installing packages
install.packages(c("sf", "ggplot2", "raster", "tmap"))# Loading packages
library(sf)
library(ggplot2)
library(raster)
library(tmap)
- Loading and Manipulating Data
Geospatial data can be loaded from various sources, including shapefiles, GeoTIFFs, or online data sources. Assuming we are working with a raster file, we use the `raster` package to load it.
# Loading a raster file
raster_data <- raster("path/to/your/raster/file.tif")# Basic visualization of raster data
plot(raster_data)
- Processing and Analysis
Depending on the objective, various analyses can be performed on the dataset, such as calculating average elevations, identifying specific areas, or applying classifications.
# Example of calculating mean elevation
mean_elevation <- cellStats(raster_data, stat = 'mean')
print(mean_elevation)
- Visualization
Visualization is a crucial part of geospatial analysis. We use `ggplot2` and `tmap` to create detailed and stylized maps.
# Converting raster data to a data frame for use with ggplot2
raster_df <- as.data.frame(rasterToPoints(raster_data), stringsAsFactors = FALSE)
colnames(raster_df) <- c("x", "y", "value")# Visualization with ggplot2
ggplot(raster_df, aes(x = x, y = y, fill = value)) +
geom_raster() +
scale_fill_viridis_c() +
theme_minimal() +
labs(title = "Geospatial Representation",
x = "Longitude",
y = "Latitude",
fill = "Elevation/Value")
For interactive visualizations, we can use `tmap`:
# Interactive visualization with tmap
tm_shape(raster_data) +
tm_raster(style = "cont", palette = "-Spectral") +
tm_layout(title = "Interactive Elevation Map")
- Interpretation
Interpreting geospatial representations requires an understanding of the variables depicted. In the provided image, areas with different altitudes or types of land cover are distinguished by different colors. Higher regions might be represented in lighter or darker colors, depending on the color scale used. This differentiation allows for quick visual identification of geographic patterns such as valleys, mountains, and plains.
R Studio, along with its dedicated packages, offers a robust solution for creating and analyzing geospatial representations. This article demonstrated a basic process from setting up the environment to visualizing and interpreting the data. With advanced practices, one can expand the analysis to include spatial modeling, predictions, and integration with more complex geographic information systems (GIS).
For those interested in further exploration, it is recommended to consult the documentation of the mentioned packages and continually practice with various datasets to enhance skills in geospatial analysis.
References
1. Nowbuth, A. A., Puckett, H. M., Scott, G. J., & Sheets, L. R. (2023). The role of remote sensing and geospatial analysis for understanding COVID-19 population severity: A systematic review. International Journal of Environmental Research and Public Health, 20 (5), 4298. https://doi.org/10.3390/ijerph20054298
2. Pebesma, E. J., & Bivand, R. S. (2022). Spatial data science: With applications in R. Chapman and Hall/CRC. ISBN 978-036-722-2678.
3. Lovelace, R., Nowosad, J., & Muenchow, J. (2019). Geocomputation with R. The R Series, CRC Press. ISBN 978-036-714-4321. https://geocompr.robinlovelace.net/
4. Jenerette, G. D., & Larsen, L. (2021). Urban land use and vegetation fragmentation patterns using R: A geospatial analysis approach. Urban Forestry & Urban Greening, 58, 126942. https://doi.org/10.1016/j.ufug.2021.126942
5. Ross, Z., & Bloom, B. J. (2020). Modern geospatial data analysis with R workshop. rstudio::conf 2020. Posit Community. https://forum.posit.co/t/modern-geospatial-data-analysis-with-r-workshop-rstudio-conf-2020/6097
See more on Milos Popovic.